Set Up & Software Guide
1. Introduction
This guide shows how to set up and install the INS1000 rover, and use the GUI. Please read it carefully.
AceinnaNav Control Software (ACS) is a graphical user interface for the AceinnaNav integrated navigation system. It displays continuous position, velocity, attitude, and trajectory information from the system. Additionally, it also provides tools to configure the system and log output data from the system. AceinnaNav version 0.19.4.8, https://www.aceinna.com/userfiles/files/Software/Inertial-System/ACS.zip
2. Installation Guide
AceinnaNav Control Software runs on Java Runtime Environment (JRE) 9. For JRE 9 download and setup, please refer to Oracle official website. To run the software, double-click the AceinnaNav.jar file.
Some PCs may not recognize the USB of the AceinnaNav system. The user needs to install the usb driver according to the system of the PC. The drivers are provided in the For Linux/For Mac/For Windows folders with the control software.
3. Connection
Before connecting to the AceinnaNav system, make sure the system’s power is on. There will be a light indicating power. Check that the USB is plugged into the computer and the control software is installed in the computer.
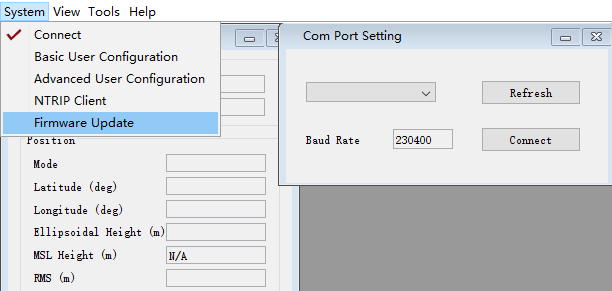
To connect to the system, use the “Com Port Setting” dialog, shown in Figure 1. The user can reopen the dialog by choosing “System > Connect” menu if it is closed.
To choose a port, first click the [Refresh] button to get the list of available ports and then select a port from the drop-down list (shown in Figure 2). The baud rate is fixed as 230400 now. After all are set, click the [Connect] button. Please try another port if the message “Cannot open the port” shows up.
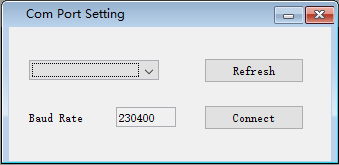
Figure 1: Connection dialog
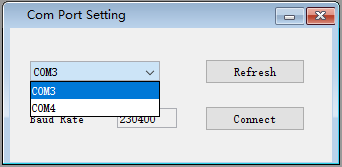
Figure 2: Port selection
4. View
4.1. Subsystems Status
At the bottom-right corner of the interface, there are four indicators for the status of IMU, GNSS, PPS and NTRIP subsystems shown in Figure 3. A flashing green circle means the subsystem is on. Normally, IMU and GNSS turn on right after the power is supplied, and PPS turns on after the time is resolved with GNSS measurements. Users may be able to see the navigation data output with enough satellite data. NTRIP indicator will be on whenever the system receives information from the base station. The user can use these four indicators to see if the system is working properly or not.

Figure 3: Subsystems status indicators
4.2. Product ID, Engine and Firmware Version
At the bottom-left corner of the interface, the user can see the product ID and the engine version of the system as shown in Figure 4.

Figure 4: Product ID and engine version
4.3. Navigation Information
Navigation information dialog (shown in Figure 5) displays the Kalman Filter navigation message from the system, including time, position, velocity and attitude information. This message comes in 1 Hz synchronized with the GNSS measurements. For more details about the message, please refer to AceinnaNav Reference Manual. The user can reopen the dialog in “View > Navigation Info” menu if it is closed.
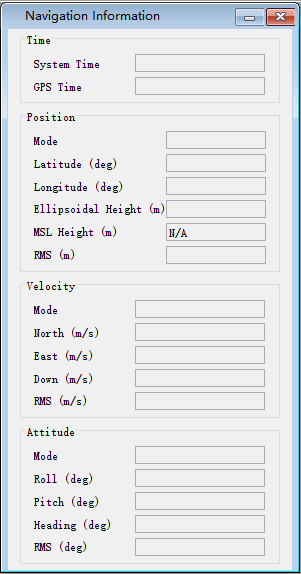
Figure 5: Navigation information dialog
4.4. Satellites Signal Status
GNSS signal status dialog (shown in Figure 6) displays the satellite signal strength information obtained from the GNSS observables. For each satellite it shows the satellite system, unique satellite number, and the L1/L2 signal strength. For more details about the message, please refer to AceinnaNav Reference Manual. The user can reopen the dialog in “System -> SV Signal” menu if it’s closed.
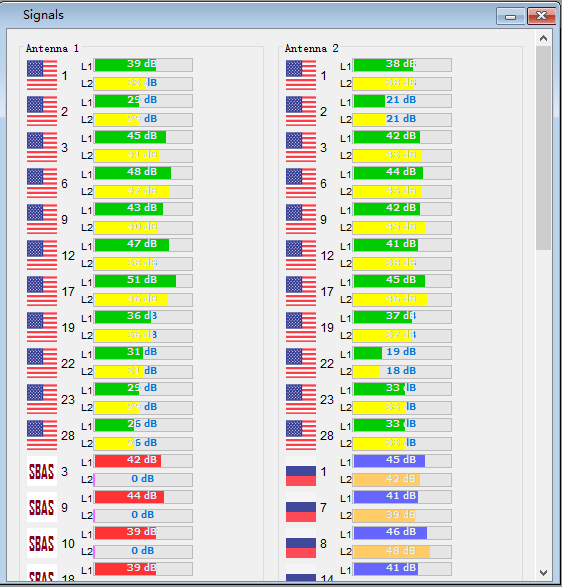
Figure 6: GNSS signal status
4.5. IMU data
IMU data dialog (show in Figure 7) displays the current acceleration and rotation rate in polyline graphs. If the IMU data doesn’t show up, the user can click the [Turn on IMU data] button to enable the output of the raw IMU data.
The direction of the axes of an IMU can be identified using the accelerometer signal. When an accelerometer is placed in upward direction on a level surface, its output should be approximately 9.8 m/s2. On the other hand, if it is place in downward direction, the output should be -9.8m/s2. Hence, for the plot in Figure 7, the positive z-axis is positing downward. The positive direction of all three axes of an IMU can be identified this way.
4.6. Trajectory
Trajectory view dialog (shown in Figure 8) displays the current trajectory. The software starts recording the trajectory when the dialog is open. When the dialog is closed, the trajectory will be cleared.

Figure 7: IMU data graphs
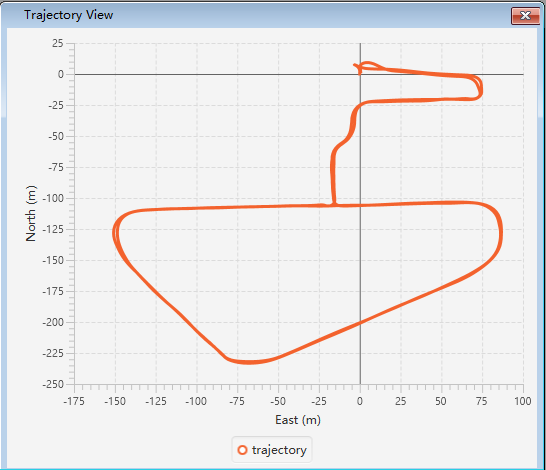
Figure 8: Trajectory view dialog
5. User Configuration
To get accurate navigation data, the user needs to configure several parameters in the navigation system. The control software provides a basic interface for necessary setup, and also an advanced interface for more detailed configuration.
5.1. Basic User Configuration
Basic user configuration dialog is used to set up the orientation of the navigation system relative to the vehicle and the position of the antennas. Once these are set up, the system can output correct position, velocity and attitude information of the vehicle.
Basic user configuration can be opened by choosing “System > Basic User Configuration”. The interface is shown in Figure 9.
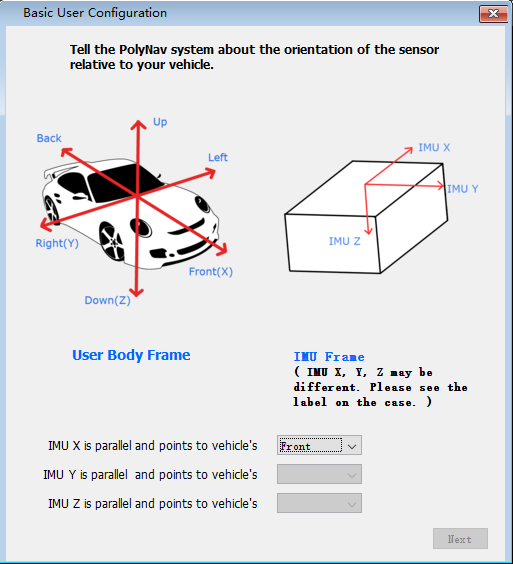
Figure 9: Set up the orientation of the navigation system
The first step is to set up the orientation of the sensor relative to the vehicle. The user first chooses the direction of the IMU X-axis relative to the user body frame. And then choose the direction of the IMU Y and Z.
For a vehicle, the user body frame is defined in Figure 10. And IMU frame is marked on the case.
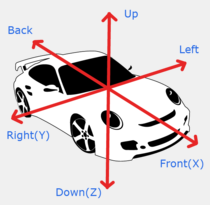
Figure 10: User body frame definition
Next step is to setup the position of the antennas (shown in Figure 11). The user needs to measure the coordinates of the two antennas in the user body frame with the origin at the case top center. And then input the coordinates into the dialog. The user also needs to measure the distance between two antenna centers and input the measurement into the dialog.
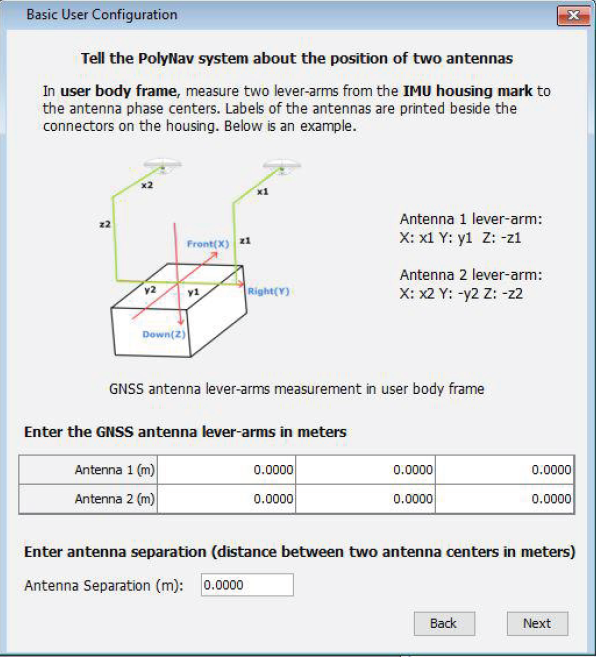
Figure 11: Set up the position of the two antennas
The final step is to choose the max output rate and turn on/off output messages (shown in Figure 12). Max output rate is the output rate of the compact navigation message (message 13). The user can adjust the data rate of this message. The detailed definition and rate of all messages can be found in Aceinna Reference Manual.
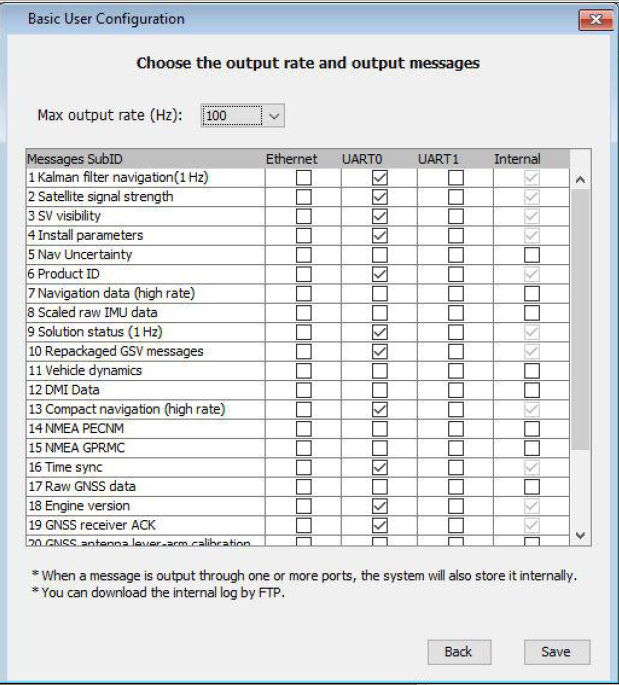
Figure 12: Choose output rate and output messages
5.2. Advanced User Configuration
Advanced user configuration dialog contains more detailed configurations of the system. To open the dialog, the user chooses “System > User Configure” from the menu (shown in Figure 13). The available configurations are shown below.
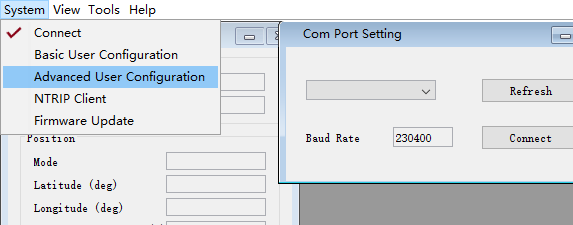
Figure 13: User configuration menu
5.2.1. Output Control
The user can do the followings in the navigation output control tab shown in Figure 14:
- Specify the navigation output position. The user can choose from the center of the IMU or the cross-mark on top of the IMU housing.
- If the static position pinning is enabled, the system will output a fixed position during a static period detected by the GNSS. Note that there is a chance that the system can miss the detection if the signal quality becomes weak.
- Specify the smooth transition interval to RTK_FIXED.
- Choose ICD messages for output. Pay specific attention when choosing high-rate outputs as outputting multiple high-rate messages can saturate the communication port.
- Check the current output position offset and whether the static position pinning is enabled in the system with the [Query] button.
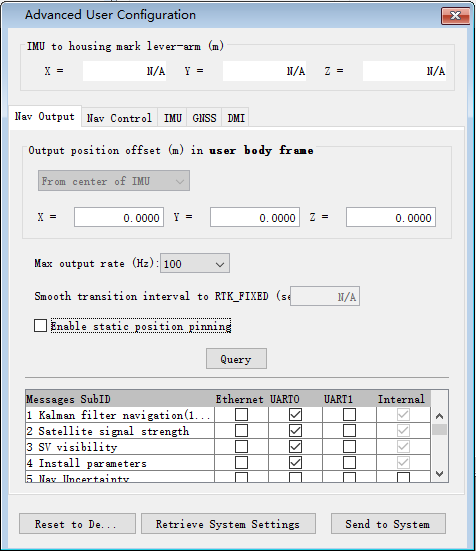
Figure 14: Navigation output control tab
5.2.2. Navigation Control
The user can control the behavior of the navigation in the tab shown in Figure 15.
The user can enable initialization of heading from the GNSS velocity. To activate this option, the x-axis of the user body frame must be aligned with the forward direction of the vehicle. See “Install Parameters” tab to set the transformation from the IMU frame to the user body frame. Also, the minimum speed for the heading initialization can be specified.
The navigation error keeps growing if no aiding source is available. The system will stop outputting the navigation results if the dead-reckoning time exceeds the maximum that the user specifies.
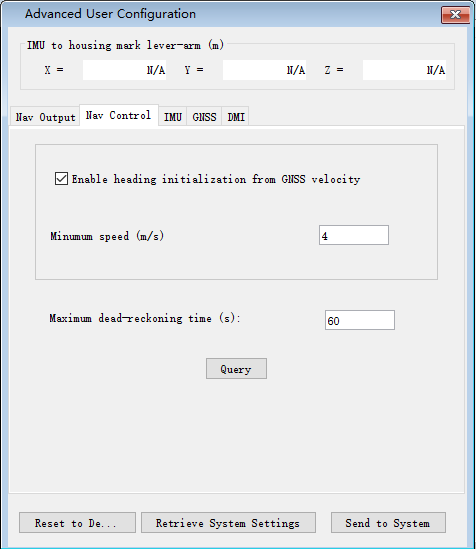
Figure 15: Navigation control tab
5.2.3. IMU Setup
In the “IMU” tab (shown in Figure 16), the user can do the followings :
- Specify the matrix for the transformation from the IMU frame to the user body frame. Please refer to the detailed Transformation Matrix in reference manual.
- Check the current transformation matrix of the system with the [Query IMU matrix] button.
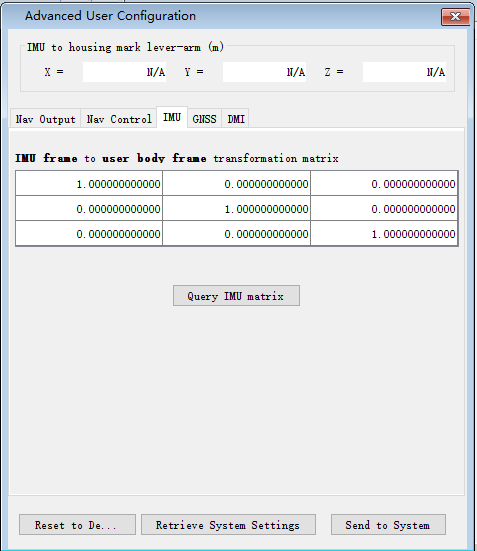
Figure 16: IMU configuration tab
5.2.4. GNSS Setup
In the “GNSS” tab (shown in Figure 17), the user can do the followings :
- Set the lever-arms of the GNSS antennas. Note that the lever-arms to be entered shall be in meters from the cross-mark on top of the IMU housing to the antennas phase center in the user body frame.
- Set the separation between two GNSS antennas, which will aid the carrier-phase ambiguity resolution for the attitude determination.
- Check the current antenna lever-arms of the system with the [Query lever-arm] button.
- Check the antenna separation of the system with the [Query] button.
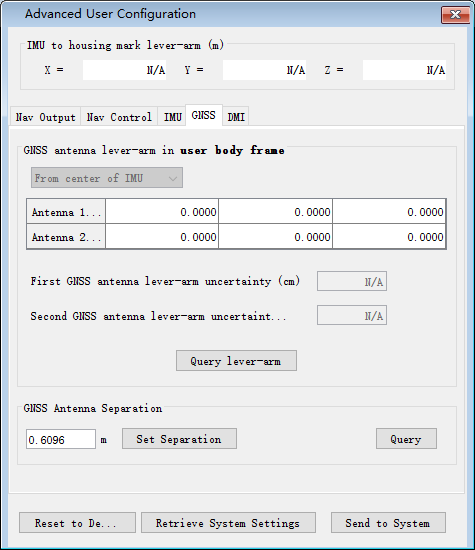
Figure 17: GNSS configuration tab
6. NTRIP Client
The user can configure the NTRIP client settings using the NTRIP Client settings dialog (shown in Figure 18). To open the dialog, choose “System > NTRIP Client” from the menu shown in Figure 19. After all information is entered, press the [Set] button to configure the NTRIP client information. After seeing a message box with “Configuration finished”, restart the system to use the new NTRIP client settings. The user can also [Query] the current NTRIP client settings of the system. To get the settings, click the [Query] button in the NTRIP Client dialog and the information will show up.
If user use “rtk2go.com” as server, the default password is “BETATEST”.
Previous NTRIP settings will be stored in the table below. The user can reuse previous settings by double-clicking that particular setting.
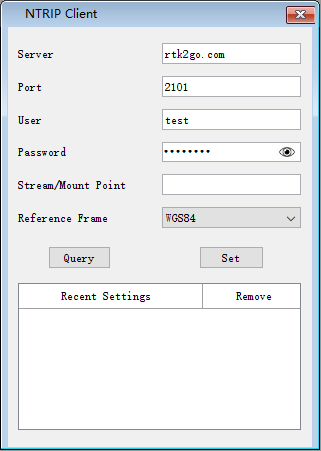
Figure 18: NTRIP client settings dialog
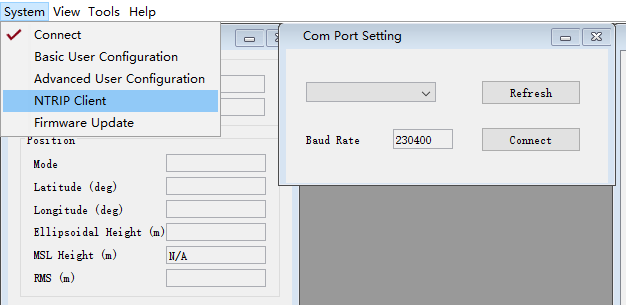
Figure 19: NTRIP Client menu
8. Tools
The control software provides tools to log and decode output data from the system.
8.1. Log Data
The user can log binary data from the system using the Export dialog by choosing the “Tools > Export” menu.
Before logging, make sure that the software has opened the right port and the status of the subsystems IMU, GNSS, and PPS are on at the bottom-right hand corner.
To choose a folder to save the data, click the [Browse] button. To log the data, click [Start Export] button in Figure 22. To finish logging, click the [Stop Export] button then a message about the saved data file name will show up. The file name convention is yyyy_mm_dd_HH_MM_SS.dat, e.g. 2018_02_09_02_36_34.dat.
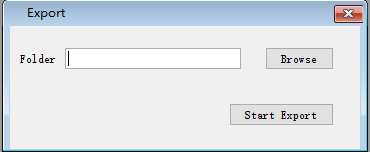
Figure 22: Data export dialog
8.2. Decode Data
The user can decode the logged data using the decoder provided by the control software. The decoder (shown in Figure 23) is available by choosing “Tools > Decode” menu. To decode a file, use the [Browse] button to find the file for decoding and then press the [Decode] button. Usually, the decode takes a few seconds to finish. For a large file, it may take up to a minute. Please wait until it is finished.
The decoded results will be stored in the same folder as the data files and consist of three files: kf.txt, *nav.txt and *.kml. The *kf.txt file stores Kalman Filter message. The *nav.txt file stores the high-rate compact navigation messages. Lastly,.kml file stores the trajectory that can be viewed in Google Earth software.
The user can choose to convert the attitude quaternion to roll, pitch, and heading using the “Attitude in roll, pitch, heading” check box. For more details about the conversion, please refer to the AceinnaNav Refence Manual.
The user can also set the output decimation rate to adjust the density of the points in the KML trajectory file. For example, entering “30” makes the decoder output to the KML file at every 30 points.
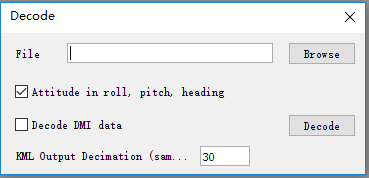
Figure 23: Data decode dialog
8.3. Zero Velocity Update
The user can send Zero Velocity Update (ZUPT) messages when the vehicle is not moving. Specifically, this will improve the navigation system where the GNSS signal is degraded. The user can set and send this message using the Zero Velocity Update dialog at the “Tools > Zero Velocity Update” menu (shown in Figure 24). After setting the horizontal and vertical standard deviation, click [Activate] button to keep sending the message containing these two values. Click [Deactivate] button to stop sending. If both values are set to zero, the message cannot be sent.
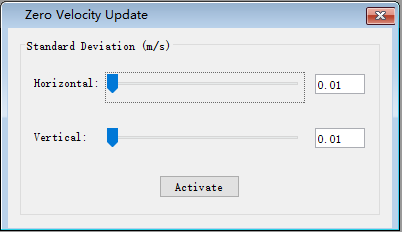
Figure 24: Zero Velocity Update dialog
8.4. Static Heading Event
The user can send a static heading event message to initialize the inertial navigator when the position is available from the GNSS receivers but the heading initialization has difficulties due to degraded GNSS signals. To send the message, the user can use the Static Heading Event dialog at the “Tools > Static Heading Event” menu (shown in Figure 25). After setting the heading, ZUPT RMS, and heading RMS, click [Activate] button to keep sending the message containing these values. Click [Deactivate] button to stop sending. If both of the ZUPT RMS, and heading RMS are set to zero, the message cannot be sent.
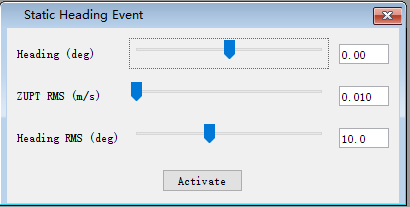
Figure 25: Static Heading Event dialog
8.5. Static Geo-Pose Event
The user can send a static geo-pose event message to initialize or aid the inertial navigation system when GNSS signals are not available. The static geo-pose event can be opened by choosing “Tools > Static Geo-Pose Event” menu (shown in Figure 26).
The user needs to input the known position and attitude information. And then click [Activate] button to keep sending these values to aid the navigation system. Click [Deactivate] button to stop sending.
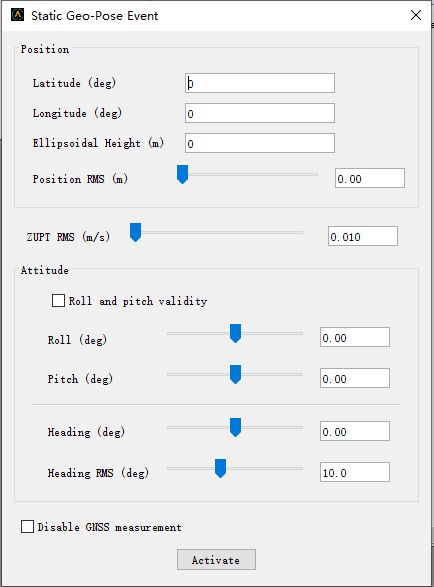
Figure 26 Static Geo-Pose Event Dialog
8.6. Heading Initialization using an External Sensor
The heading can be initialized using the NMEA message “$HEHDT” which could be generated by other sensors in the user’s vehicle. To use this initialization method, the output port of the user’s sensor needs to be connected to one of the input ports of the Aceinna-Nav system; either UART0 or Ethernet. To enforce this initialization method, please make sure to turn off the option initializing the heading from the GNSS velocity; see Figure 15.
9. Internal Data Download
The system internally stores the raw sensor data and navigation data, of which the naming convention is as follows:
- Raw sensor data: raw_wwww_ssssss.dat
- Navigation data: nav_wwww_ssssss.dat
Where “wwww” and “ssssss” corresponding to the GPS week number and seconds of the week at the start of the mission.
User can download the internal data using any FTP client, following the next steps:
- Set the computer Ethernet IP address as 192.168.100.xxx where xxx could be any number from 2 to 254, except 97, because the address 192.168.100.97 used as the rover ip address.
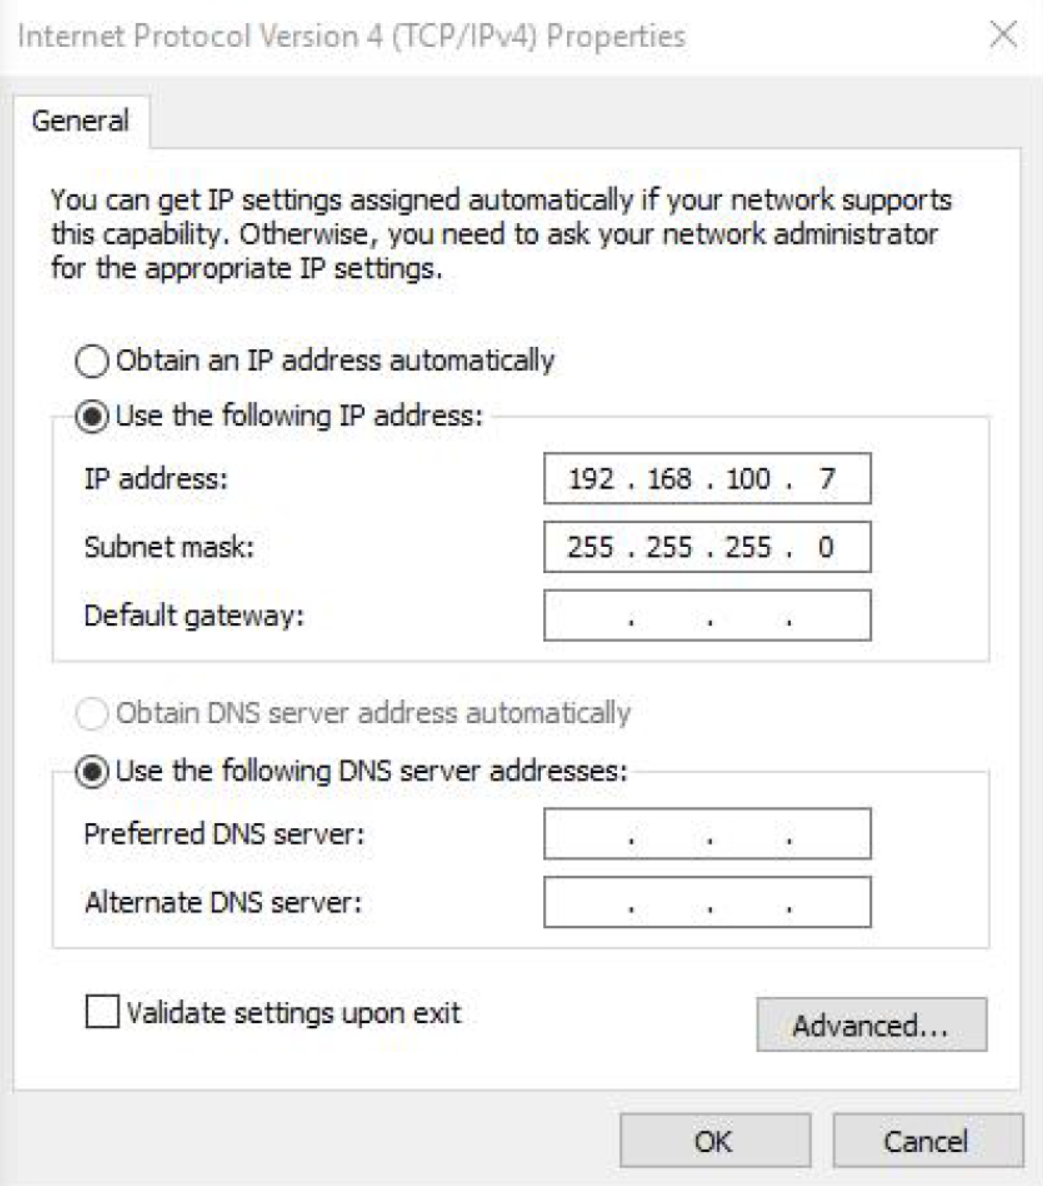
Figure 27: IP address setting
Power on the rover station system, then use a FTP client in PC side to connect the system following the configurations, Host name: 192.168.100.97,Port number: 2100,User name: ftp,Password: ftppw. After connection setup successfully, user could see the raw data and navigation data in the FTP client.
10. web application
The web application is composed of two parts, one part is python driver that log the data from serial port and upload to web application user interface, another part is the web application user interface. For the python driver,user could download it from github. https://github.com/Aceinna/python-ins1000
| Flag | Description |
| KFN | Kalman Filter Navigation Message |
| CNM | Compact Navigation Message (High Rate) |
| SSS | Satellite Signal Strength |
| GSVM | Repackaged GSV Message |
The table above is data format of python drive, and could be found in json file(rover.json) located in the path python-ins1000-master->setting.
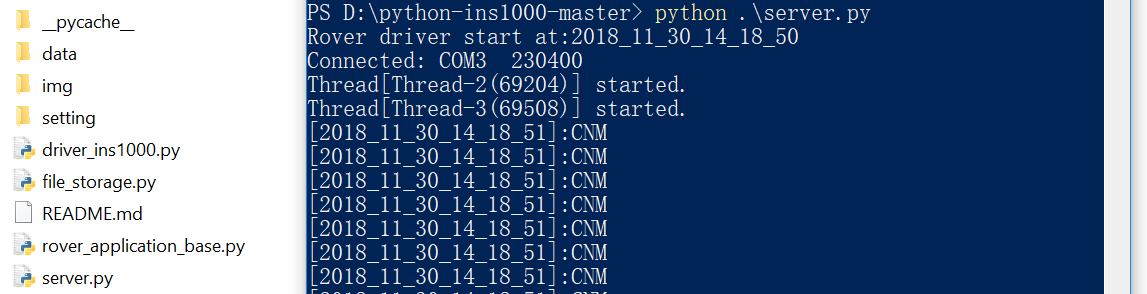
Figure 28: python serial tool usage
User could run the python script and then upload data to web application user interface, for the web application ui, https://developers.aceinna.com/maps
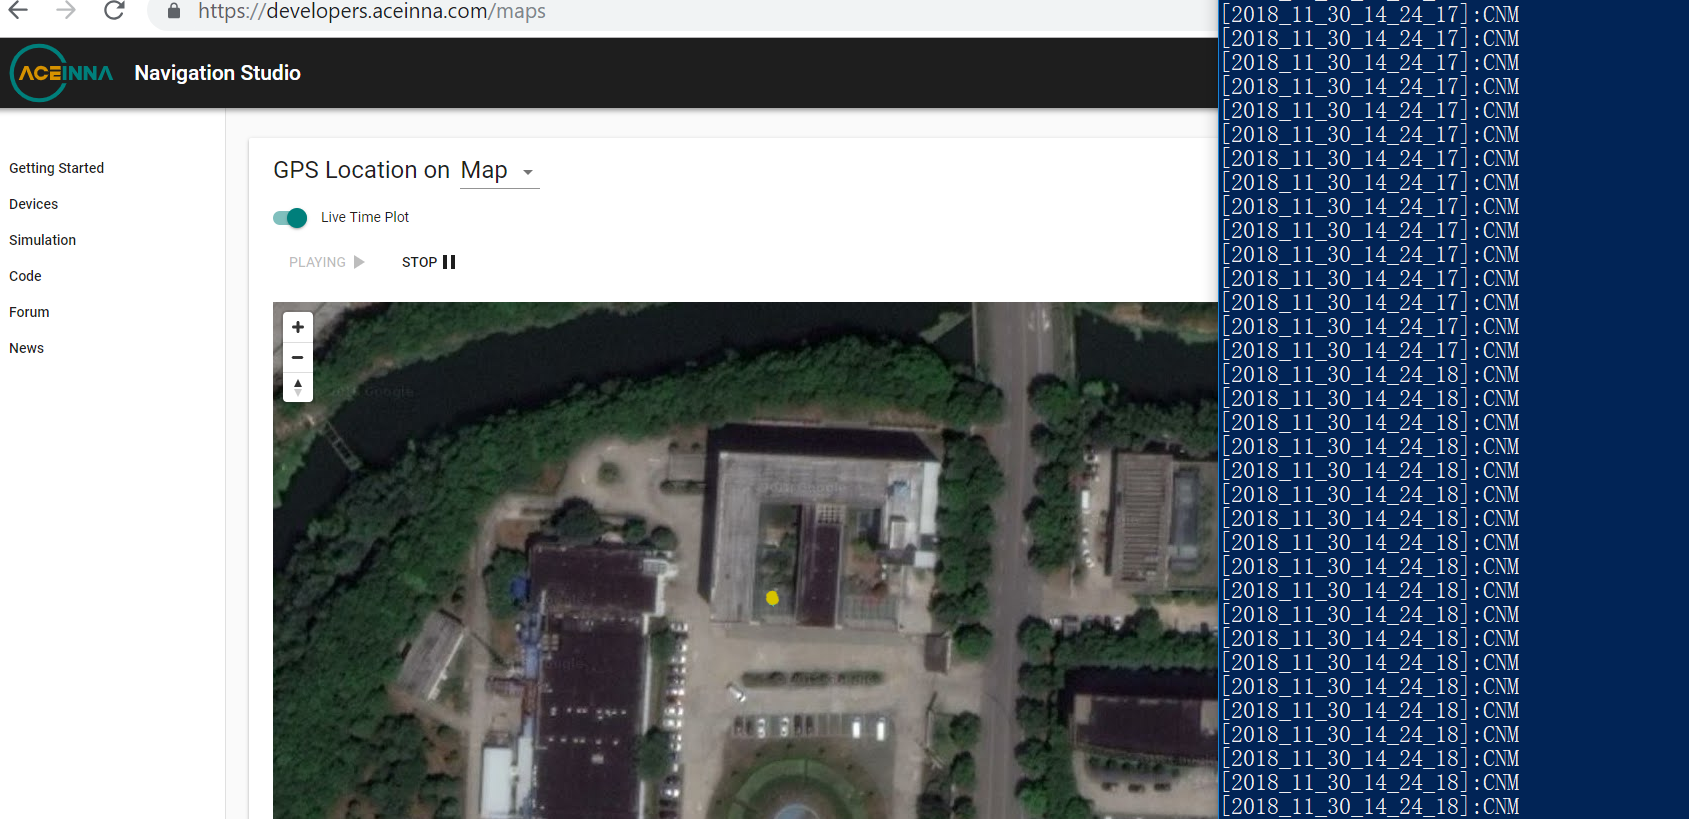
Figure 29: web application usage
Press the button(Live Time Plot) on the web application ui, the image of live path of the rover station is shown on the screen. Meanwhile, the data will be logged synchronously in folder: python-ins1000-master->data.
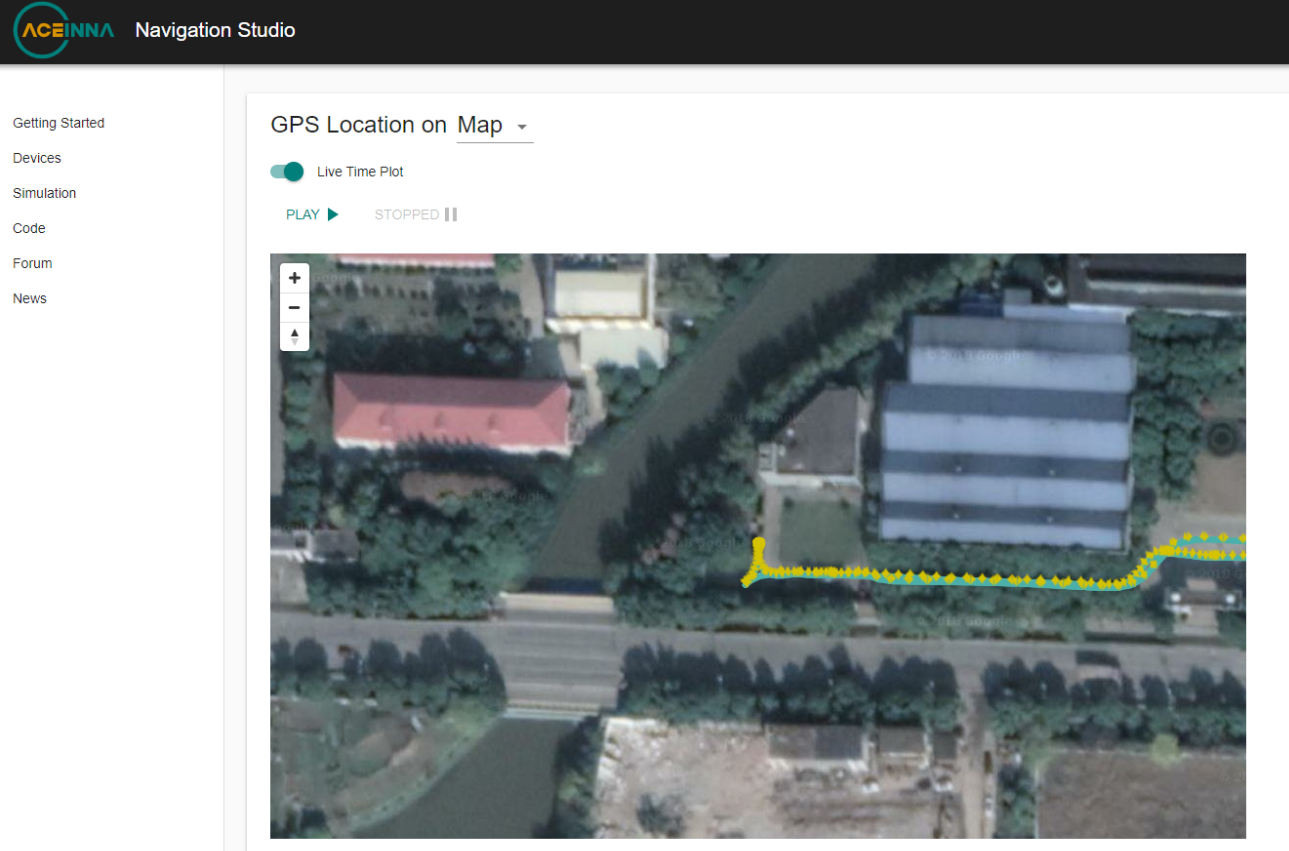
Figure 30: real time path demo